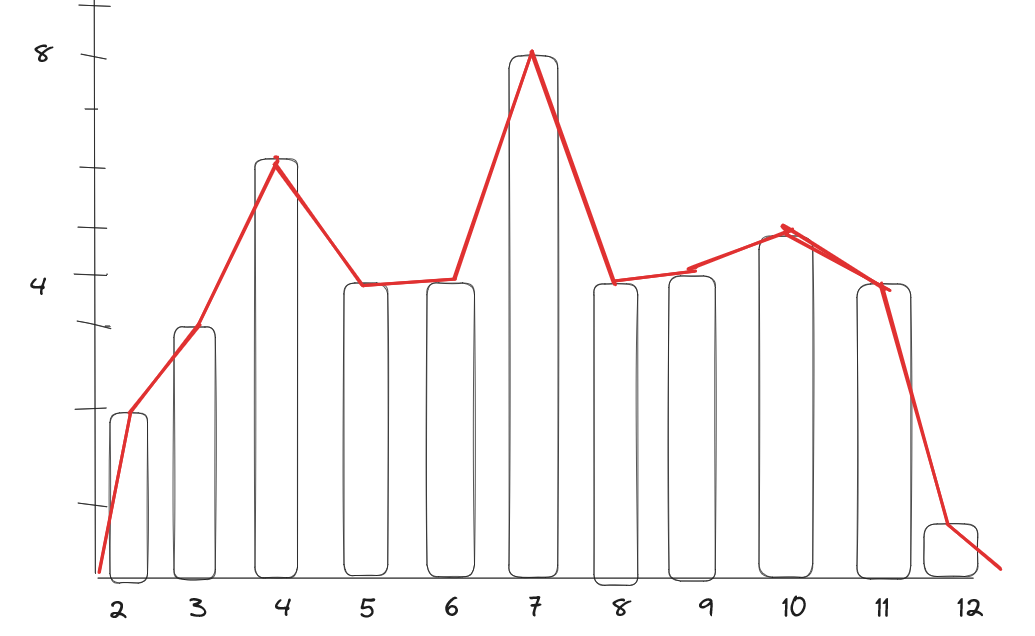
Discrete
Say we have some raw data for 45 sums of 2 dice.
11 4 4 10 7 7 6 6 5
10 3 5 11 8 7 8 6 7
12 2 7 10 9 4 5 3 4
11 3 9 11 2 9 4 7 6
10 4 8 10 8 7 9 7 5
| sum | tally | frequencies | relative frequency (empirical probability) |
|---|---|---|---|
| 2 | II | 2 | 2/45 |
| 3 | III | 3 | 3/45 |
| 4 | VI | 6 | 6/45 |
| 5 | IV | 4 | 4/45 |
| 6 | IV | 4 | 4/45 |
| 7 | VIII | 8 | 8/45 |
| 8 | IV | 4 | 4/45 |
| 9 | IV | 4 | 4/45 |
| 10 | V | 5 | 5/45 |
| 11 | IV | 4 | 4/45 |
| 12 | I | 1 | 1/45 |
Frequency Polygon(OGIVE)
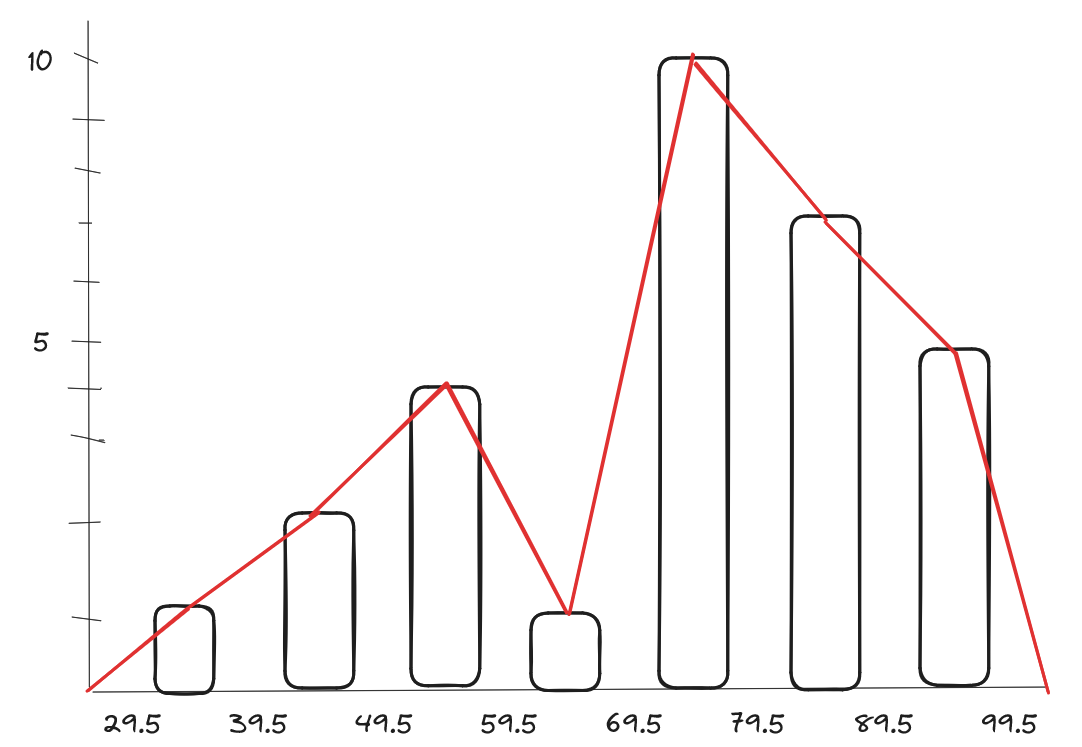
Continuous
raw data for grades:
76 81 86 55 60 98 55 86 70 75
70 74 70 35 56 79 88 44 51 40
73 88 90 94 99 87 74 77 80 92
How we find our range is, we first choose an interval. 10 is a good interval, we can go with 10. then, total range of data / interval is the # of rows we can have. the range of our data is between 99 - 35 = 64. 64 is the range 64 / 10 = 6.4. rounded up = 7 rows.
| range | tally | frequency | relative frequency (experimental probability) |
|---|---|---|---|
| 29.5-39.5 | I | 1 | 1/30 |
| 39.5-49.5 | II | 2 | 2/30 |
| 49.5-59.5 | IV | 4 | 4/30 |
| 59.5-69.5 | I | 1 | 1/30 |
| 69.5-79.5 | X | 10 | 10/30 |
| 79.5-89.5 | VII | 7 | 7/30 |
| 89.5-99.5 | V | 5 | 5/30 |
Frequency Polygon (OGIVE)