Table of Contents
Practical Logarithm Use Cases
Shrinking Ranges
Log is very good for graphing phenomena that take on a very wide range of values For example, if we have a table like such that we wanted to graph:
| Animal | Rat | Cat | Wolf | Horse | Elephant | Whale |
|---|---|---|---|---|---|---|
| Mass(kg) | 0.2 | 4 | 80 | 300 | 5400 | 7000 |
| Graphing this out would be horrendous. It would maybe look something like: | ||||||
| ![[Logarithm Scales-20231211163454942.webp | 184]] | |||||
| most of the values are near the bottom | ||||||
| If we log all masses though, |
| Animal | Rat | Cat | Wolf | Horse | Elephant | Whale |
|---|---|---|---|---|---|---|
| log(mass) | -0.7 | 1.6 | 1.9 | 2.477 | 3.732 | 3.845 |
| ![[Logarithm Scales-20231211163757798.webp | 320]] | |||||
| We dont even need log paper to graph this out, just get a simple grid paper! |
Determining Growth
From a table of stocks,
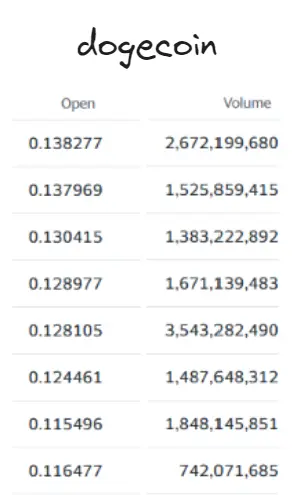 Graphing this out may look something like this:
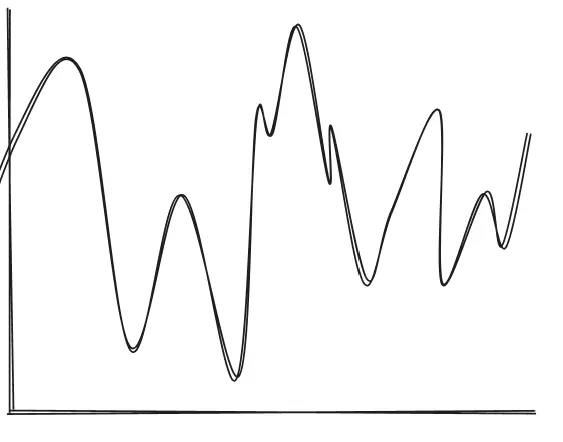 But, this doesn’t tell us anything!
If we log the graph, we can see if it is slowing down.
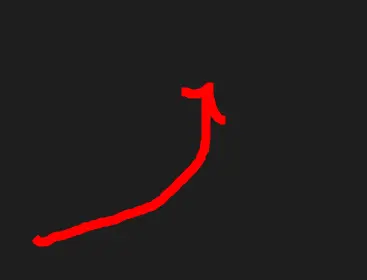
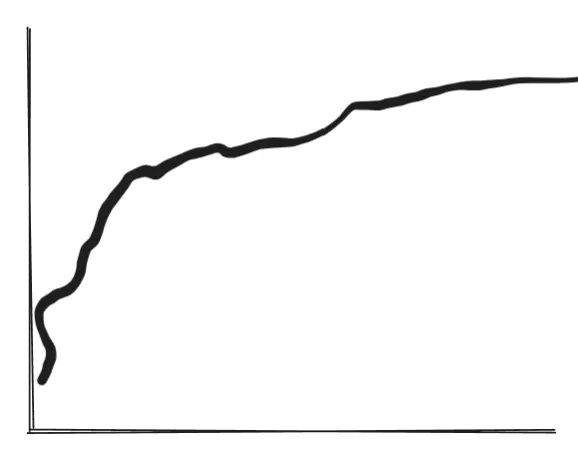 If you log the graph and it looks like its smiling, then BUY BUY NOW!
 If you log the graph and looks its frowning, then DONT BUY
Logarithm Scales
You will be able to explain all visible phenomena through logarithmic scale.