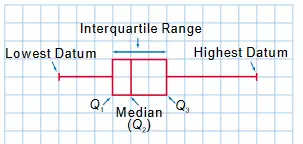
- 3 points divide the data set into 4 equal groups.
- Q (The first quartile) is the middle number between the smallest number and the median
- (The second quartile) is the median of data set (known as the 50th percentile)
- (The third quartile) is the middle number between the median and largest number
Range : the highest value - lowest value
Interquartile Range
The difference between the first and third quartiles
Semi-Interquartile/Mid-Quartile
1/2 the difference between the first and third quartiles. affected very little by the extreme scores. good skew if you have outliers.
Box and Whisker Plot
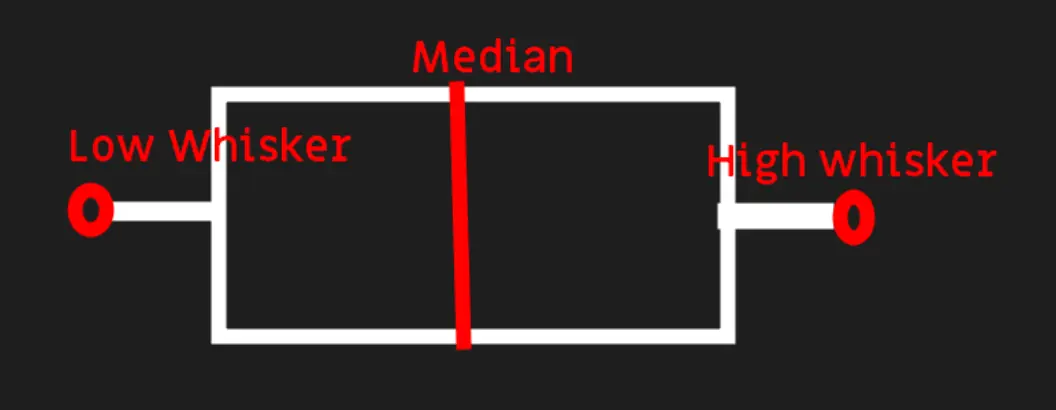 Low whisker is the smallest value
High whisker is the highest value
The box spans the interquartile range.
Low whisker is the smallest value
High whisker is the highest value
The box spans the interquartile range.
Classifying Quartiles
Say we have our quartiles laid out.
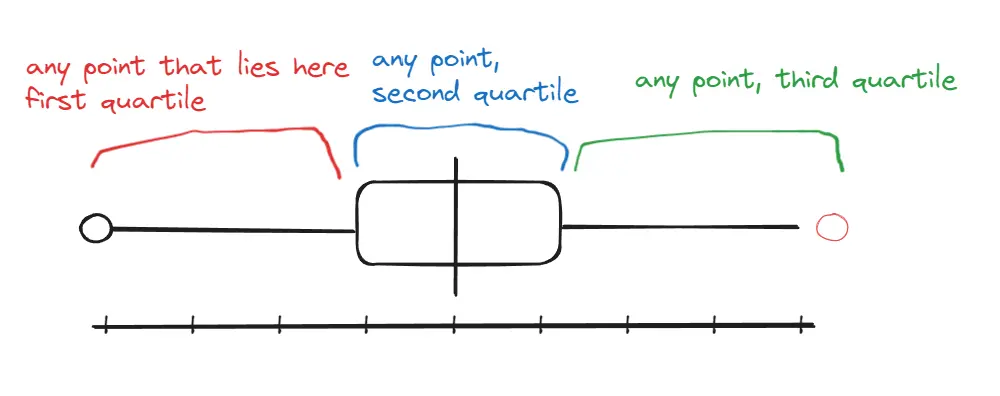 and point within those ranges, you would classify them like quartile one.
For example, if quartile one spanned from 0-16 and you had a point 15, that point you say, would be in quartile one.
and point within those ranges, you would classify them like quartile one.
For example, if quartile one spanned from 0-16 and you had a point 15, that point you say, would be in quartile one.