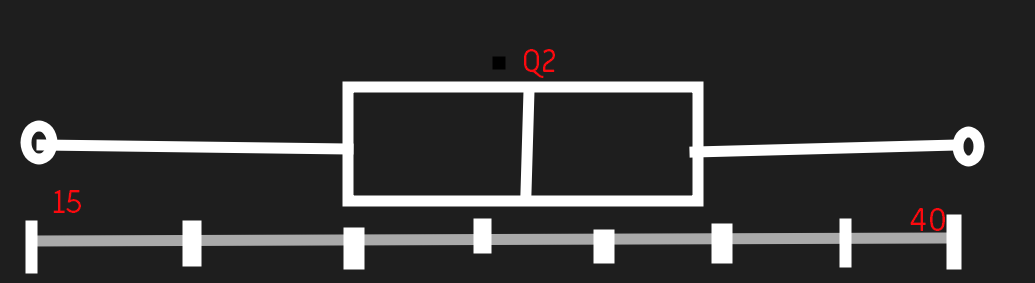
Example raw data: 31 28 28 30 20 25 38 40 26 28 15 21 28 36 25 16 21 34 37 30 23 24 36 32 25 Again, sort it from least to greatest. Q1 is 25 percentile Q2 is 50 percentile Q3 is 75 percentile Box and Whisker plot