Presents potential prospects of a product. You require:
- 2 Variables. They can be independent, but they must have a mutual dependency, i.e money or time
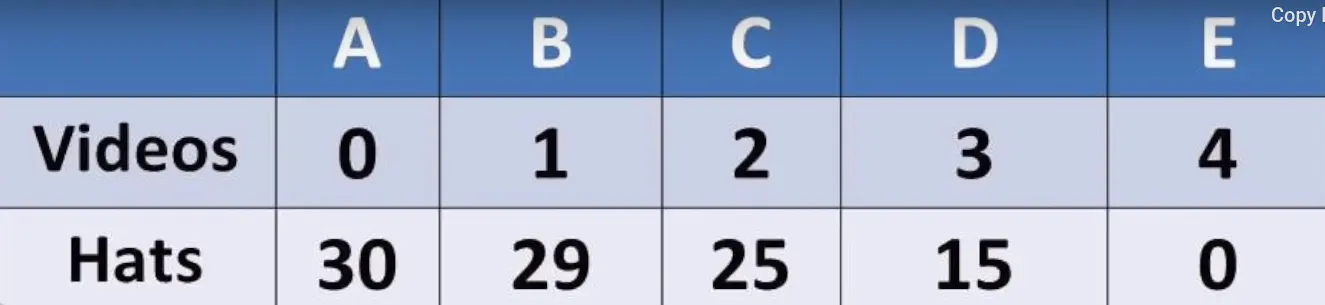 As one variable rises, the other decreases.
To get the curve, you need to plot the graph with one variable as x and the other as y. It doesn’t matter which one you choose for x or y.
As one variable rises, the other decreases.
To get the curve, you need to plot the graph with one variable as x and the other as y. It doesn’t matter which one you choose for x or y.
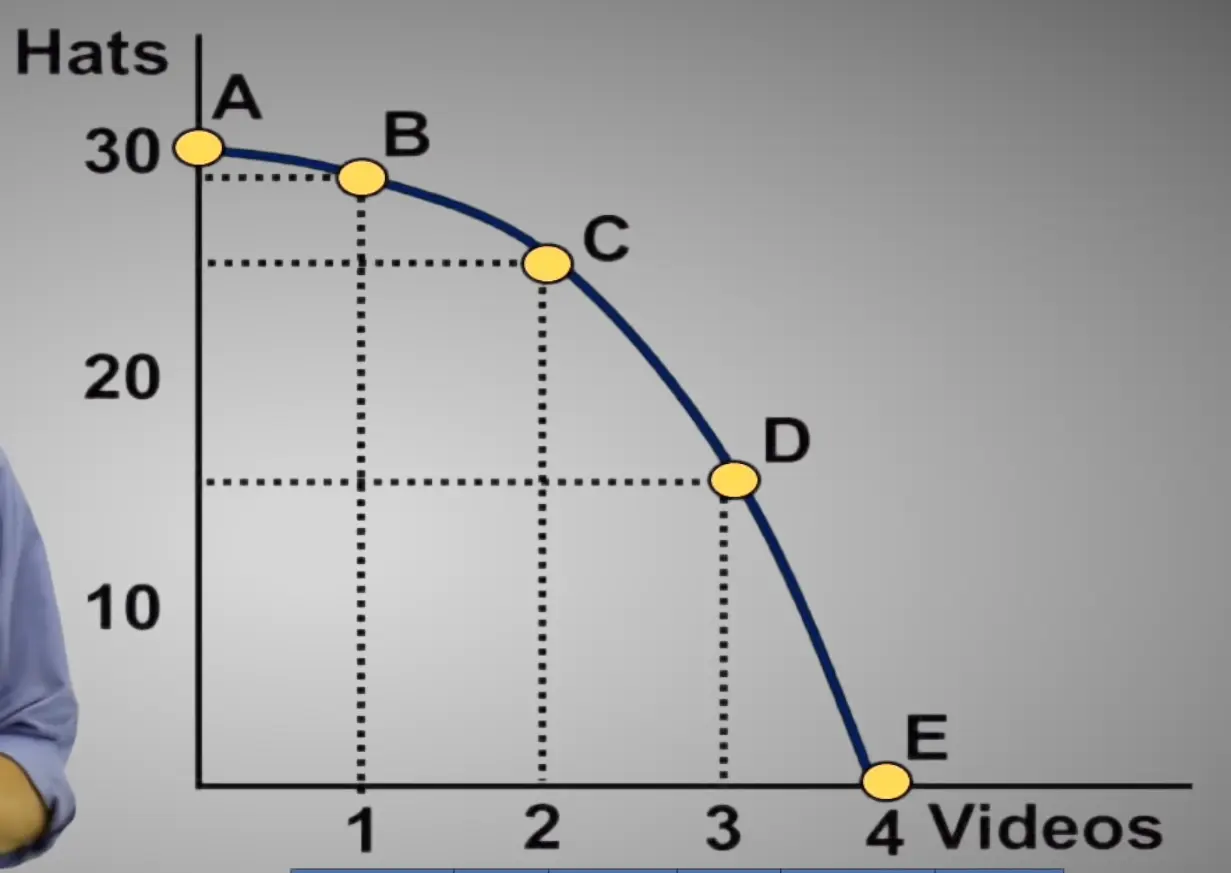 All the points on the curve mean we are using all our resources, none left behind. No time is wasted.
If a point lies within the curve, then it means we are not using all our resources.
And a point outside the curve is impossible because there is no metaphysical way we use 110% of our resources.
All the points on the curve mean we are using all our resources, none left behind. No time is wasted.
If a point lies within the curve, then it means we are not using all our resources.
And a point outside the curve is impossible because there is no metaphysical way we use 110% of our resources.