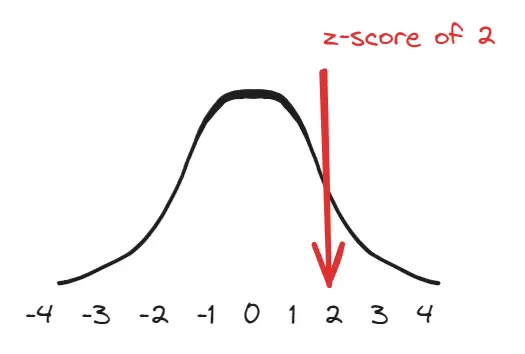
Z-score is a way for us to explain how many standard deviations we are from the center(0)
So a z-score of 2 will mean we are 2 standard deviations from the mean
Z-Score formula
Standardization
We are able to turn any Normal Distribution into a Standard Normal Distribution
For example, this distribution:
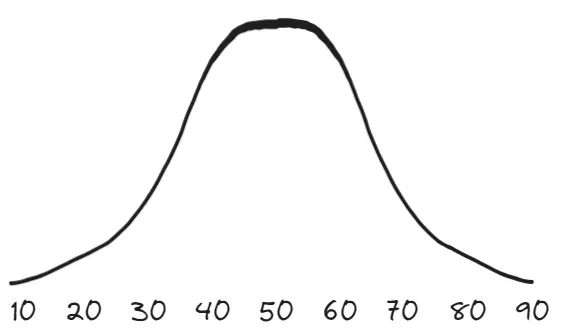 = 50
= 25.81988897
= 50
= 25.81988897
Perform z-scores of all the data points:
| x | z-score of x |
|---|---|
| 10 | -1.54919338 |
| 20 | -1.161895004 |
| 30 | -0.774596669 |
| 40 | -0.487298334 |
| 50 | 0 |
| 60 | 0.387289334 |
| 70 | 0.774596669 |
| 80 | 1.161895004 |
| 90 | 1.549193338 |
Z-Score Table
The z-score table is a table to tell us the percentile rank of the distribution a z-score means.
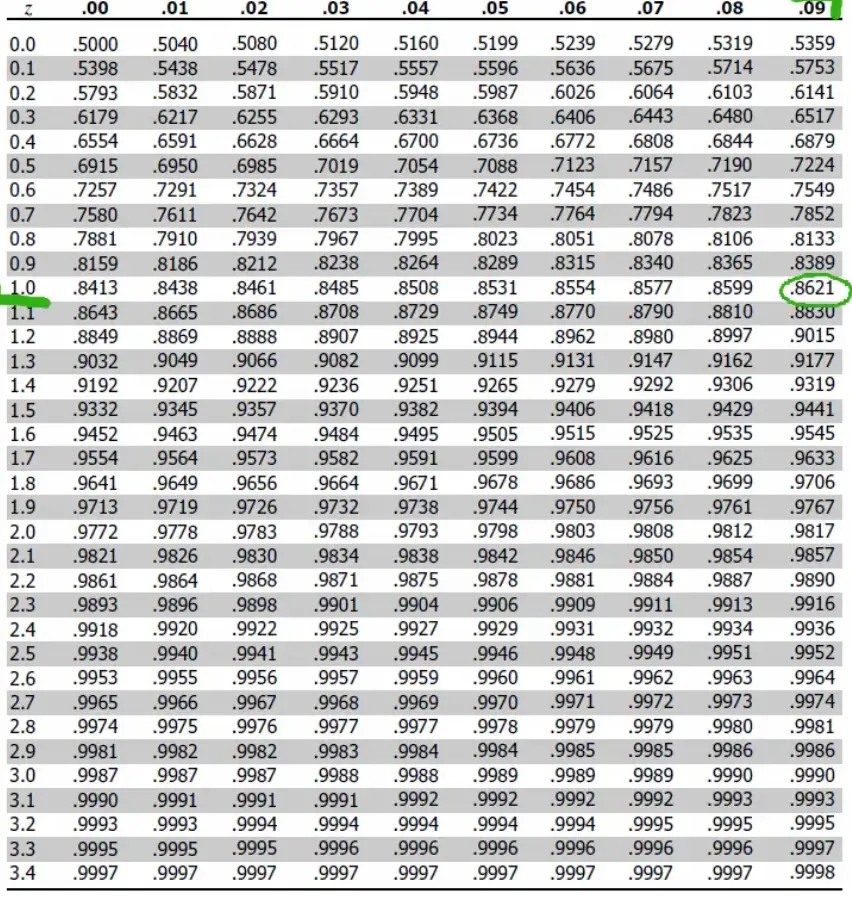 You need to combine a column and row and you get the area (<X) to the left(the percentile rank).
so 3.49 will be the row 3.4 and the column 0.09
You need to combine a column and row and you get the area (<X) to the left(the percentile rank).
so 3.49 will be the row 3.4 and the column 0.09